When done right, performance dashboards are powerful tools. They help your team quickly assess whether you’re making progress, what’s working well, what’s off track, and where immediate attention is needed. Many of our clients approach dashboards with the best intentions but often get stuck on one tricky aspect: how to interpret the performance data.
That’s where targets and thresholds come in. Also known as target ranges, RAG (Red-Amber-Green) statuses, or alert levels, these tools help turn raw data into meaningful insights by drawing clear comparisons that support better decision-making. Unfortunately, this is where many would-be analysts get stuck: how do you set those levels appropriately? Let’s walk through it.
Understand the Purpose of Thresholds
Some critics point to challenges with thresholds—such as visual limitations for color-blind users or the fear of fostering a punitive, quota-driven culture. While those concerns are valid, using performance targets and thresholds, when done well, offers real benefits. They provide clear, measurable goals that align teams, guide decisions, and help monitor progress. Thresholds define acceptable levels of performance and signal when a discussion around potential corrective action is needed. Together, they promote accountability, support resource allocation, and drive continuous improvement. It’s not about punitive actions but informed dialog.
Make the Terminology Work for You
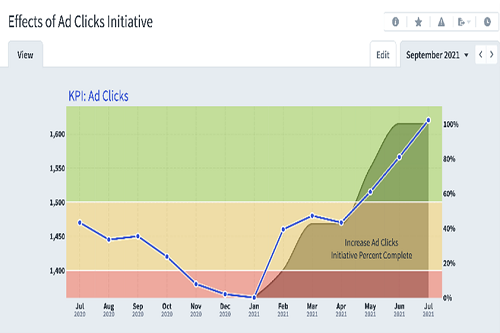
The simplest and most common model is the goal–red flag structure. In this setup:
- Green = good performance
- Yellow/Amber = caution or medium performance
- Red = poor performance
For example, if your sales goal is $1 million, but falling below $800,000 means the business loses money, you’d set $1 million as the goal and $800,000 as the red flag. A dashboarding tool like Spider Impact can then visualize performance relative to those points. If you end the year at $900,000, the system marks performance as yellow—signaling that you’re below goal but above the danger zone. This visual clarity helps executives and teams quickly understand trends and take timely action.
Start with Strategy
Targets and thresholds shouldn’t be based on guesswork. They should be rooted in your strategic objectives. Before setting any threshold, ask:
- What are we trying to accomplish? What outcomes are we trying to achieve?
- What performance level defines success?
- When should we be concerned and take corrective action?
This clarity ensures your dashboard reflects what truly matters to the organization.
Consider Your Baseline Performance Level
Your past performance is a key point of reference. By analyzing historical data, you can identify trends, strengths, and areas needing improvement. This context helps set future targets that are ambitious yet realistically achievable.
Consider Customer and Strategic Needs
Customer or stakeholder expectations can, in many cases, directly influence your performance levels. Their preferences, pain points, and service demands help define what “good” looks like. Sometimes a service-level agreement defines the desired levels of performance but usually a conversation is needed to map out expectations. Aligning targets and thresholds with these needs ensures you’re delivering real value, boosting satisfaction, and earning long-term loyalty.
Communicate with Clear Logic
For your team to stay aligned and take meaningful action, they need to understand the logic behind the numbers. Employees will be suspect of any targets they believe leadership created arbitrarily. When targets and thresholds are communicated clearly—linked to a clear new venture, past results, customer insights, or other logical benchmarks—they’re easier to trust and follow. This trust helps drive buy-in, collaboration, and consistent focus.
Review and Adjust Regularly
Dashboards aren’t static. They should spark ongoing dialog about performance. Each trend or data point is part of a story – why are we getting these results? Have priorities shifted? Are new risks or opportunities emerging? As your goals evolve, so should your thresholds. Make performance reviews a regular habit.
Final Thoughts
A dashboard isn’t just a reporting tool—it’s an enabler for strategic decision-making. Thoughtful thresholds ensure your data leads to action. When everyone knows what’s good, what’s risky, and what needs fixing, your organization moves faster, stays aligned, and achieves more.
Ready to set smarter thresholds?
Learn how to build effective KPIs and manage performance with our KPI Professional Certification Program.
Need dashboarding support?
Visit our Spider Impact page or explore Spider Strategies to see how smarter dashboards can transform your business.

David Wilsey is the Chief Executive Officer with the Balanced Scorecard Institute and co-author of The Institute Way: Simplify Strategic Planning and Management with the Balanced Scorecard.